Overview
Animating your ggplot2 visualizations is easy using the gganimate package. But did you also know that gganimate can be used with the ggmap package to animate geographic data? Using data from Nashville Open Data, we’ll create an animation to visualize the development of parks in Nashville over time.
Data cleaning and exploration
First, we load in the data.
Code
# Read in data
df <-
  read_csv("Parks_Property_2016.csv") %>%
  janitor::clean_names() %>%
  select(lat, long = lon, year_established = year_estab, acres, park_name =  common_nam)
Code
df %>%
  kable(format = "html") %>%
  kable_styling("striped") %>%
scroll_box(height="500px")| lat | long | year_established | acres | park_name |
|---|---|---|---|---|
| 3.607738e+01 | -86.95922 | 1988 | 69.8600000 | Harpeth River |
| 3.605943e+01 | -86.93816 | 1972 | 9.8800000 | Harpeth Knoll |
| 3.607160e+01 | -86.93354 | 1982 | 17.1400000 | Red Caboose |
| 3.615017e+01 | -86.92646 | 2007 | 809.5900000 | Bells Bend |
| 3.626076e+01 | -86.91984 | 1996 | 2168.7920000 | Beaman |
| 3.605688e+01 | -86.90744 | 1937 | 1113.1200000 | Edwin Warner |
| 3.613620e+01 | -86.88757 | 2012 | 8.5300000 | H. G. Hill |
| 3.606729e+01 | -86.88420 | 1926 | 1991.5600000 | Percy Warner |
| 3.615454e+01 | -86.87071 | 1964 | 25.2400000 | Charlotte |
| 3.631718e+01 | -86.87022 | 1989 | 18.3800000 | Joelton |
| 3.616150e+01 | -86.86422 | 1952 | 33.4500000 | West |
| 3.617850e+01 | -86.83915 | 1964 | 12.2600000 | Bordeaux Garden |
| 3.611866e+01 | -86.83532 | 1988 | 3.2400000 | Woodmont |
| 3.615925e+01 | -86.83257 | 1947 | 11.2800000 | Boyd -Taylor |
| 3.634344e+01 | -86.86116 | 2013 | 98.4100000 | Paradise Ridge |
| 3.610406e+01 | -86.86017 | 1988 | 8.3900000 | Parmer |
| 3.620875e+01 | -86.82747 | 1964 | 54.2000000 | Hartman |
| 3.613357e+01 | -86.82402 | 1927 | 13.0700000 | Elmington |
| 3.615638e+01 | -86.85505 | 2014 | 11.2500000 | England |
| 3.616553e+01 | -86.82243 | 1912 | 30.7000000 | Hadley |
| 3.619058e+01 | -86.82113 | 1954 | 261.1700000 | Rhodes |
| 0.000000e+00 | 0.00000 | 0 | 0.3400000 | East Jr. Tennis Courts |
| 3.620718e+01 | -86.85206 | 2012 | 34.8500000 | Mullins |
| 3.613922e+01 | -86.84705 | 1938 | 208.9800000 | McCabe |
| 3.615153e+01 | -86.84464 | 1907 | 9.9800000 | Richland |
| 3.621440e+01 | -86.84351 | 1980 | 16.8100000 | Bordeaux-Timothy |
| 3.615160e+01 | -86.79200 | 1975 | 0.5900000 | Owen Bradley |
| 3.627492e+01 | -86.81879 | 1978 | 19.7000000 | Whites Creek |
| 3.615774e+01 | -86.81796 | 1969 | 1.5000000 | McKissack |
| 3.617482e+01 | -86.81664 | 1983 | 7.3600000 | Fisk |
| 3.611058e+01 | -86.80866 | 1999 | 1.5300000 | Sally Beaman |
| 3.613682e+01 | -86.80631 | 1978 | 7.6500000 | Dragon |
| 3.609537e+01 | -86.80484 | 1973 | 13.0300000 | Green Hills |
| 3.617866e+01 | -86.80315 | 1909 | 1.6000000 | Elizabeth |
| 3.613167e+01 | -86.80244 | 1996 | 1.7100000 | St. Bernard |
| 3.616257e+01 | -86.79951 | 1901 | 8.1200000 | Watkins |
| 3.615941e+01 | -86.79734 | 1979 | 0.8600000 | Edmondson |
| 3.614940e+01 | -86.81340 | 1903 | 125.1400000 | Centennial |
| 3.617086e+01 | -86.79474 | 2000 | 0.4000000 | Hope Gardens |
| 3.618075e+01 | -86.78999 | 1910 | 6.6300000 | Morgan |
| 3.614644e+01 | -86.78956 | 2012 | 0.3500000 | Flora Wilson |
| 3.615004e+01 | -86.78945 | 1975 | 2.3100000 | Tony Rose |
| 3.611917e+01 | -86.78919 | 1945 | 20.4100000 | Sevier |
| 3.619941e+01 | -86.78749 | 1969 | 3.4200000 | Lock One |
| 3.604615e+01 | -86.75473 | 1979 | 6.9500000 | Granbery |
| 3.614350e+01 | -86.78345 | 1960 | 25.0800000 | Rose |
| 3.616269e+01 | -86.78181 | 2001 | 0.2800000 | Church Street |
| 3.613750e+01 | -86.78087 | 1914 | 15.9000000 | Reservoir |
| 3.613438e+01 | -86.77809 | 1981 | 1.3200000 | Neil |
| 3.616685e+01 | -86.77809 | 2006 | 6.0100000 | Public Square |
| 3.615921e+01 | -86.77682 | 2005 | 2.6700000 | Walk of Fame |
| 3.616832e+01 | -86.75391 | 1963 | 7.9600000 | Kirkpatrick |
| 3.621581e+01 | -86.75174 | 1983 | 26.2800000 | Oakwood |
| 3.617000e+01 | -86.78000 | 1977 | 3.4900000 | Bicentennial |
| 3.616222e+01 | -86.77611 | 2000 | 0.3100000 | Commerce Center |
| 3.616424e+01 | -86.77530 | 1930 | 0.6600000 | Fort Nashborough |
| 0.000000e+00 | 0.00000 | 2002 | 0.1000000 | Crieve Hall School Playground |
| 0.000000e+00 | 0.00000 | 2002 | 0.1000000 | Jordonia School Playground |
| 3.614503e+01 | -86.77421 | 1928 | 57.3900000 | Fort Negley |
| 3.616256e+01 | -86.77404 | 1983 | 5.2900000 | Riverfront |
| 3.623509e+01 | -86.77146 | 1973 | 10.4600000 | Parkwood |
| 3.625341e+01 | -86.77143 | 2003 | 12.1300000 | Willow Creek |
| 3.607724e+01 | -86.72783 | 2007 | 13.5300000 | Caldwell |
| 3.616249e+01 | -86.77058 | 2012 | 4.7551980 | Cumberland |
| 3.618177e+01 | -86.76702 | 1920 | 11.1300000 | McFerrin |
| 3.614385e+01 | -86.76534 | 1913 | 6.4400000 | Dudley |
| 3.627176e+01 | -86.74802 | 1965 | 321.4600000 | Cedar Hill |
| 3.617057e+01 | -86.74634 | 1996 | 0.5600000 | Shelby Walk |
| 3.610819e+01 | -86.74541 | 2006 | 0.7430000 | Turner School |
| 3.617793e+01 | -86.76230 | 1963 | 31.9400000 | Douglas |
| 3.617287e+01 | -86.76041 | 1916 | 10.6500000 | East Park |
| 3.618830e+01 | -86.75971 | 1963 | 18.4500000 | Cleveland |
| 3.620367e+01 | -86.75968 | 1991 | 6.8100000 | Tom Joy |
| 3.615160e+01 | -86.75898 | 1983 | 0.4000000 | Mildred Shute |
| 3.615007e+01 | -86.75654 | 1913 | 2.2200000 | Napier |
| 3.611188e+01 | -86.74425 | 1939 | 8.7700000 | Coleman |
| 3.617516e+01 | -86.74182 | 1921 | 0.1800000 | Bass |
| 3.608775e+01 | -86.74002 | 0 | 196.5900000 | Grassmere |
| 3.606692e+01 | -86.73968 | 1978 | 13.6700000 | Whitfield |
| 3.619271e+01 | -86.73947 | 1953 | 2.4400000 | Eastland |
| 3.617616e+01 | -86.73717 | 2013 | 2.2300000 | Lockeland Springs |
| 3.617055e+01 | -86.73295 | 1912 | 343.3100000 | Shelby |
| 3.618291e+01 | -86.70550 | 1997 | 950.1800000 | Shelby Bottoms |
| 3.619700e+01 | -86.72762 | 1972 | 19.1400000 | South Inglewood |
| 3.622800e+01 | -86.72445 | 1995 | 5.7000000 | Litton |
| 3.609511e+01 | -86.71480 | 1973 | 35.6800000 | Paragon Mills |
| 3.609215e+01 | -86.70763 | 2003 | 4.1900000 | Providence |
| 3.605723e+01 | -86.70645 | 1982 | 26.9400000 | Pitts |
| 3.624415e+01 | -86.70246 | 1956 | 5.7300000 | Lock Two |
| 3.626582e+01 | -86.70099 | 1988 | 30.7400000 | Madison |
| 3.610830e+01 | -86.69954 | 1963 | 76.0100000 | Seven Oaks |
| 3.618991e+01 | -86.68239 | 1966 | 374.3000000 | Two Rivers |
| 0.000000e+00 | 0.00000 | 2002 | 0.1000000 | Andrew Jackson School Playground |
| 3.608808e+01 | -86.67803 | 1978 | 79.9400000 | Ezell |
| 3.605559e+01 | -86.67340 | 1950 | 7.9800000 | Antioch |
| 3.618528e+01 | -86.66682 | 2002 | 74.3800000 | Heartland |
| 3.620519e+01 | -86.65257 | 1965 | 649.7100000 | Peeler |
| 3.609890e+01 | -86.63865 | 2007 | 24.9800000 | Una |
| 3.600102e+01 | -86.63764 | 1971 | 6.2500000 | Crawford |
| 3.624013e+01 | -86.63373 | 2011 | 4.4000000 | Lakewood |
| 3.618753e+01 | -86.63272 | 2006 | 9.7600000 | Stone Hall |
| 3.610490e+01 | -86.62597 | 1980 | 381.3600000 | Hamilton Creek |
| 3.599103e+01 | -86.61878 | 1983 | 274.1300000 | Cane Ridge |
| 0.000000e+00 | 0.00000 | 2002 | 0.1000000 | Kings Lane School Playground |
| 0.000000e+00 | 0.00000 | 2002 | 0.1000000 | Dan Mills School Playground |
| 0.000000e+00 | 0.00000 | 2002 | 0.1000000 | Pennington Bend School Playground |
| 0.000000e+00 | 0.00000 | 2002 | 0.1000000 | Schwab School Playground |
| 3.617756e+01 | -86.61507 | 1999 | 22.1900000 | Hermitage |
| 3.617318e+01 | -86.79860 | 1984 | 0.6800000 | Monroe |
| 3.618239e+01 | -86.85325 | 1963 | 19.7800000 | City Cemetery |
| 0.000000e+00 | 0.00000 | 2002 | 0.1000000 | Tulip Grove School Playground |
| 0.000000e+00 | 0.00000 | 2002 | 0.1000000 | Hermitage School Playground |
| 0.000000e+00 | 0.00000 | 2002 | 0.1000000 | Hattie Cotton School Playground |
| 0.000000e+00 | 0.00000 | 2002 | 0.1000000 | Rosebank School Playground |
| 0.000000e+00 | 0.00000 | 2002 | 0.1000000 | Stanford School Playground |
| 0.000000e+00 | 0.00000 | 2002 | 0.1000000 | Hickman Elm School Playground |
| 0.000000e+00 | 0.00000 | 2002 | 0.1000000 | Cockrill School Playground |
| 0.000000e+00 | 0.00000 | 2002 | 0.1000000 | Park Ave School Playground |
| 0.000000e+00 | 0.00000 | 2002 | 0.1000000 | Jones Paideia School Playground |
| 0.000000e+00 | 0.00000 | 0 | 1.0200000 | Hillwood School Tennis Courts |
| 3.610288e+01 | -86.68115 | 2006 | 64.1700000 | Soccer Complex |
| 3.618239e+01 | -86.85325 | 1976 | 5.0000000 | County Cemetery |
| 0.000000e+00 | 0.00000 | 2002 | 0.1000000 | Glencliff School Playground |
| 0.000000e+00 | 0.00000 | 0 | 0.6800000 | Glencliff Tennis Courts |
| 0.000000e+00 | 0.00000 | 2002 | 0.1000000 | Lakeview School Playground |
| 0.000000e+00 | 0.00000 | 2002 | 0.1000000 | Norman Binkley School Playground |
| 0.000000e+00 | 0.00000 | 2002 | 0.1000000 | Haywood School Playground |
| 0.000000e+00 | 0.00000 | 0 | 0.5100000 | Bellevue Tennis Courts |
| 0.000000e+00 | 0.00000 | 2002 | 0.1000000 | Moss School Playground |
| 0.000000e+00 | 0.00000 | 0 | 0.5100000 | Ewing Park Tennis Courts |
| 3.619124e+01 | -86.81393 | 1934 | 46.4800000 | Buena Vista |
| 3.619149e+01 | -86.81267 | 1934 | 4.9700000 | Potters Field |
| 3.613298e+01 | 86.90497 | 2003 | 14.1400000 | Brookmeade |
| 0.000000e+00 | 0.00000 | 2002 | 0.1000000 | Stratton School Playground |
| 0.000000e+00 | 0.00000 | 2002 | 0.1000000 | Dupont School Playground |
| 0.000000e+00 | 0.00000 | 2002 | 0.1000000 | Neely's Bend School Playground |
| 0.000000e+00 | 0.00000 | 0 | 0.5100000 | Neely's Bend Tennis Courts |
| 0.000000e+00 | 0.00000 | 0 | 0.5100000 | Maplewood Tennis Courts |
| 0.000000e+00 | 0.00000 | 2002 | 0.1000000 | Percy Priest School Playground |
| 0.000000e+00 | 0.00000 | 2002 | 0.1000000 | Tusculum School Playground |
| 0.000000e+00 | 0.00000 | 0 | 0.5100000 | Mcmurray Tennis Courts |
| 0.000000e+00 | 0.00000 | 2002 | 0.1000000 | Cole School Playground |
| 0.000000e+00 | 0.00000 | 2002 | 0.1000000 | Mt. View School Playground |
| 0.000000e+00 | 0.00000 | 2002 | 0.1000000 | Charlotte School Playground |
| 0.000000e+00 | 0.00000 | 2002 | 0.1000000 | Old Center School Playground |
| 0.000000e+00 | 0.00000 | 2002 | 0.1000000 | Paragon Mills School Playground |
| 0.000000e+00 | 0.00000 | 2002 | 0.1000000 | Whitsett School Playground |
| 0.000000e+00 | 0.00000 | 2002 | 0.1000000 | Chadwell School Playground |
| 0.000000e+00 | 0.00000 | 0 | 0.6800000 | Hillsboro Tennis Courts |
| 0.000000e+00 | 0.00000 | 2002 | 0.1000000 | Tom Joy School Playground |
| 0.000000e+00 | 0.00000 | 2002 | 0.1000000 | Una School Playground |
| 0.000000e+00 | 0.00000 | 2002 | 0.1000000 | Sylvan Park School Playground |
| 0.000000e+00 | 0.00000 | 0 | 0.6800000 | Overton Tennis Courts |
| 0.000000e+00 | 0.00000 | 2002 | 0.1000000 | Amquie School Playground |
| 0.000000e+00 | 0.00000 | 2002 | 0.1000000 | Harpeth School Playground |
| 0.000000e+00 | 0.00000 | 2002 | 0.1000000 | Julia Green School Playground |
| 0.000000e+00 | 0.00000 | 2002 | 0.1000000 | Alex Green School Playground |
| 0.000000e+00 | 0.00000 | 2002 | 0.1000000 | Mcgavock School Playground |
| 0.000000e+00 | 0.00000 | 2002 | 0.1000000 | Ruby Major School Playground |
| 0.000000e+00 | 0.00000 | 2002 | 0.1000000 | Cora Howe School Playground |
| 0.000000e+00 | 0.00000 | 2002 | 0.1000000 | Shayne School Playground |
| 0.000000e+00 | 0.00000 | 2002 | 0.1000000 | Dodson School Playground |
| 0.000000e+00 | 0.00000 | 2002 | 0.1000000 | Maxwell School Playground |
| 0.000000e+00 | 0.00000 | 0 | 0.5100000 | Stratford Tennis Courts |
| 0.000000e+00 | 0.00000 | 2002 | 0.1000000 | Fall-Hamilton School Playground |
| 0.000000e+00 | 0.00000 | 2002 | 0.1000000 | Edmonson Library Playground |
| 0.000000e+00 | 0.00000 | 2002 | 0.1000000 | Hull Jackson School Playground |
| 0.000000e+00 | 0.00000 | 2002 | 0.1000000 | Ross School Playground |
| 0.000000e+00 | 0.00000 | 0 | 0.5100000 | Granbery School Tennis Courts |
| 0.000000e+00 | 0.00000 | 0 | 0.3400000 | Antioch Tennis Courts |
| 3.624002e+01 | -86.64811 | 2012 | 84.0000000 | Crooked Branch |
| 3.611668e+01 | -86.78903 | 2013 | 5.4000000 | Gale Lane |
| 0.000000e+00 | 0.00000 | 2004 | 0.1345503 | Cumberland River Greenway - Metro Center |
| 3.625271e+01 | -86.64679 | 2013 | 6.0100000 | Old Hickory Baseball |
| 3.625579e+01 | -86.64605 | 2013 | 2.4100000 | Rachel's Walk |
| 3.626437e+01 | -86.65058 | 2013 | 0.4500000 | Veterans |
| 3.626542e+01 | -86.64965 | 2013 | 13.5800000 | Old Hickory |
| 3.626393e+01 | -86.65150 | 2013 | 0.1200000 | Old Hickory Community Center |
| 3.625664e+01 | -86.65259 | 2013 | 1.6100000 | Old Hickory Arts |
| 3.625845e+01 | -86.64896 | 2013 | 2.3900000 | 12th Street Ballfield |
| 3.611722e+01 | -86.71963 | 2013 | 62.6100000 | Whitsett |
| 0.000000e+00 | 0.00000 | 2003 | 1.5553245 | Stones River Greeenway - Two Rivers to Lytle |
| 3.601296e+01 | -86.69024 | 2013 | 85.6200000 | Mill Creek |
| 3.618238e+01 | -86.65910 | 2013 | 615.9000000 | Lytle Farm |
| 3.616015e+01 | -86.77186 | 2015 | 12.5400000 | Ascend Amphitheater |
| 3.605297e+01 | -86.65626 | 2014 | 12.1363239 | Southeast Community Center |
| 0.000000e+00 | 0.00000 | 2003 | 0.4646216 | Stones River Greeenway - Two Rivers to Lytle |
| 0.000000e+00 | 0.00000 | 2003 | 2.3579139 | Stones River Greeenway - Two Rivers to Lytle |
| 0.000000e+00 | 0.00000 | 2003 | 0.1121120 | Stones River Greeenway - Two Rivers to Lytle |
| 1.735803e+06 | 666357.14396 | 2012 | 0.6655799 | Gulch Greenway |
| 1.736155e+06 | 665443.67692 | 2015 | 0.4948844 | Gulch Greenway |
| 1.737172e+06 | 670336.24990 | 2001 | 0.2594513 | Cumberland River Greenway - Bicentennial Connector |
| 3.619003e+01 | -86.64606 | 2015 | 172.4690974 | Ravenwood |
| 0.000000e+00 | 0.00000 | 2001 | 2.5000000 | Cumberland River Greenway - Bicentennial Connector |
| 3.611345e+01 | -86.77666 | 2012 | 0.3481739 | Browns Creek Park |
| 0.000000e+00 | 0.00000 | 2001 | 0.7298034 | Cumberland River Greenway - SB trailhead |
| 0.000000e+00 | 0.00000 | 2008 | 0.0493584 | Cumberland River Greenway - Downtown |
| 0.000000e+00 | 0.00000 | 2008 | 0.0818948 | Cumberland River Greenway - Downtown |
| 0.000000e+00 | 0.00000 | 2008 | 0.0117001 | Cumberland River Greenway - Downtown |
| 0.000000e+00 | 0.00000 | 2008 | 1.7948271 | Cumberland River Greenway - Downtown |
| 0.000000e+00 | 0.00000 | 2008 | 0.1613896 | Cumberland River Greenway - Downtown |
| 0.000000e+00 | 0.00000 | 2008 | 0.0167640 | Cumberland River Greenway - Downtown |
| 0.000000e+00 | 0.00000 | 2008 | 0.2653782 | Cumberland River Greenway - Downtown |
| 0.000000e+00 | 0.00000 | 2004 | 11.9566555 | Whites Creek Greenway - Hartman Park |
| 0.000000e+00 | 0.00000 | 2005 | 2.7587219 | Whites Creek Greenway - Hartman Park |
| 0.000000e+00 | 0.00000 | 2004 | 0.8719442 | Whites Creek Greenway - Hartman Park |
| 0.000000e+00 | 0.00000 | 2006 | 1.0000000 | Whites Creek Greenway - Hartman Park |
| 0.000000e+00 | 0.00000 | 2008 | 0.5361007 | Cumberland River Greenway - Downtown |
| 0.000000e+00 | 0.00000 | 2008 | 0.6990988 | Cumberland River Greenway - Downtown |
| 0.000000e+00 | 0.00000 | 2004 | 2.1957676 | Cumberland River Greenway - Metro Center |
| 0.000000e+00 | 0.00000 | 2008 | 0.6213730 | Cumberland River Greenway - Downtown |
| 0.000000e+00 | 0.00000 | 2004 | 1.0171761 | Cumberland River Greenway - Metro Center |
| 0.000000e+00 | 0.00000 | 2004 | 0.8803449 | Cumberland River Greenway - Metro Center |
| 0.000000e+00 | 0.00000 | 2004 | 1.4035318 | Cumberland River Greenway - Metro Center |
| 0.000000e+00 | 0.00000 | 2004 | 0.1757014 | Cumberland River Greenway - Metro Center |
| 0.000000e+00 | 0.00000 | 2004 | 0.1910113 | Cumberland River Greenway - Metro Center |
| 0.000000e+00 | 0.00000 | 2004 | 0.3268539 | Cumberland River Greenway - Metro Center |
| 0.000000e+00 | 0.00000 | 2004 | 0.8981220 | Cumberland River Greenway - Metro Center |
| 0.000000e+00 | 0.00000 | 2004 | 0.1643947 | Cumberland River Greenway - Metro Center |
| 0.000000e+00 | 0.00000 | 2004 | 0.8378213 | Cumberland River Greenway - Metro Center |
| 0.000000e+00 | 0.00000 | 2004 | 2.2856454 | Cumberland River Greenway - Metro Center |
| 0.000000e+00 | 0.00000 | 2004 | 0.1554352 | Cumberland River Greenway - Metro Center |
| 0.000000e+00 | 0.00000 | 2004 | 0.4177268 | Cumberland River Greenway - Metro Center |
| 0.000000e+00 | 0.00000 | 2008 | 0.6409715 | Cumberland River Greenway - Downtown |
| 0.000000e+00 | 0.00000 | 2008 | 0.2436326 | Cumberland River Greenway - Downtown |
| 0.000000e+00 | 0.00000 | 2004 | 0.6941219 | Cumberland River Greenway - Metro Center |
| 0.000000e+00 | 0.00000 | 2004 | 0.1009122 | Cumberland River Greenway - Metro Center |
| 0.000000e+00 | 0.00000 | 2004 | 0.1245130 | Cumberland River Greenway - Metro Center |
| 0.000000e+00 | 0.00000 | 2001 | 0.2207411 | Cumberland River Greenway - Bicentennial Connector |
| 0.000000e+00 | 0.00000 | 2001 | 0.4808856 | Cumberland River Greenway - Bicentennial Connector |
| 0.000000e+00 | 0.00000 | 2001 | 1.0315835 | Cumberland River Greenway - Downtown |
| 0.000000e+00 | 0.00000 | 2001 | 0.0586311 | Cumberland River Greenway - Downtown |
| 0.000000e+00 | 0.00000 | 2009 | 1.8924259 | Cumberland River Greenway - Boyd Taylor |
| 0.000000e+00 | 0.00000 | 2001 | 1.1242000 | Cumberland River Greenway - Downtown |
| 0.000000e+00 | 0.00000 | 1995 | 4.7682243 | Harpeth River Greenway - Warner - Morton Mill |
| 0.000000e+00 | 0.00000 | 2008 | 23.1109609 | Harpeth River Greenway - Warner - Warner Exchange |
| 0.000000e+00 | 0.00000 | 2013 | 33.2810709 | Harpeth River Greenway - Warner - Harpeth Bend |
| 0.000000e+00 | 0.00000 | 2013 | 3.1920090 | Harpeth River Greenway - Warner - Harpeth Valley |
| 0.000000e+00 | 0.00000 | 1995 | 9.4195271 | Harpeth River Greenway - Warner - Morton Mill |
| 0.000000e+00 | 0.00000 | 2013 | 9.0121617 | Harpeth River Greenway - Warner - Harpeth Crest |
| 0.000000e+00 | 0.00000 | 2013 | 4.0313277 | Harpeth River Greenway - Harpeth Springs |
| 0.000000e+00 | 0.00000 | 2013 | 12.0255760 | Harpeth River Greenway - Harpeth Springs |
| 0.000000e+00 | 0.00000 | 2006 | 7.8561414 | Harpeth River Greenway - River Walk |
| 0.000000e+00 | 0.00000 | 2006 | 1.4861100 | Harpeth River Greenway - River Walk |
| 0.000000e+00 | 0.00000 | 2006 | 1.8113980 | Harpeth River Greenway - River Walk |
| 0.000000e+00 | 0.00000 | 2006 | 7.1464777 | Harpeth River Greenway - River Walk |
| 0.000000e+00 | 0.00000 | 2006 | 10.9477867 | Harpeth River Greenway - River Walk |
| 0.000000e+00 | 0.00000 | 2006 | 5.5703800 | Harpeth River Greenway - River Walk |
| 0.000000e+00 | 0.00000 | 2006 | 2.4222613 | Harpeth River Greenway - River Walk |
| 0.000000e+00 | 0.00000 | 2013 | 0.1684959 | Harpeth River Greenway - Warner - Harpeth Bend |
| 0.000000e+00 | 0.00000 | 1995 | 2.2458589 | Harpeth River Greenway - Warner - Morton Mill |
| 0.000000e+00 | 0.00000 | 2002 | 32.7153412 | Mill Creek Greenway - Blue Hole |
| 0.000000e+00 | 0.00000 | 2002 | 6.8735880 | Mill Creek Greenway - Blue Hole |
| 0.000000e+00 | 0.00000 | 2001 | 5.0335253 | Mill Creek Greenway - Ezell Park |
| 0.000000e+00 | 0.00000 | 2001 | 3.5095535 | Mill Creek Greenway - Ezell Park |
| 0.000000e+00 | 0.00000 | 2014 | 3.5486258 | Mill Creek Greenway - Mill Creek Park |
| 0.000000e+00 | 0.00000 | 2002 | 50.2175012 | Mill Creek Greenway - Blue Hole |
| 0.000000e+00 | 0.00000 | 2002 | 10.5583895 | Mill Creek Greenway - Blue Hole |
| 0.000000e+00 | 0.00000 | 2015 | 25.9882102 | Mill Creek Greenway-Rivendell |
| 0.000000e+00 | 0.00000 | 2006 | 2.2191096 | Richland Creek Creenway - White Bridge Connector |
| 0.000000e+00 | 0.00000 | 2014 | 9.6707414 | Mill Creek Greenway - Mill Creek Park |
| 0.000000e+00 | 0.00000 | 2014 | 0.3969118 | Mill Creek Greenway - Mill Creek Park |
| 0.000000e+00 | 0.00000 | 2006 | 9.5489080 | Richland Creek Creenway - White Bridge Connector |
| 0.000000e+00 | 0.00000 | 2006 | 3.9594254 | Richland Creek Creenway - White Bridge Connector |
| 0.000000e+00 | 0.00000 | 2006 | 1.1946428 | Richland Creek Creenway - White Bridge Connector |
| 0.000000e+00 | 0.00000 | 2006 | 1.3220493 | Richland Creek Creenway - White Bridge Connector |
| 0.000000e+00 | 0.00000 | 2004 | 0.0532986 | Richland Creek Creenway - Lion's Head Connector |
| 0.000000e+00 | 0.00000 | 2004 | 15.3544355 | Richland Creek Creenway -McCabe Loop |
| 0.000000e+00 | 0.00000 | 2010 | 2.0813361 | Richland Creek Creenway - Knob Road Connector |
| 0.000000e+00 | 0.00000 | 2013 | 1.7147314 | Cumberland River Greenway - Rolling Mill Hill |
| 0.000000e+00 | 0.00000 | 2003 | 3.5618533 | Stones River Greenway - Lebanon Pk to Dam |
| 0.000000e+00 | 0.00000 | 2008 | 53.2851401 | Seven Mile Creek Greenway - Ellington Ag |
| 0.000000e+00 | 0.00000 | 2008 | 1.5429462 | Seven Mile Creek Greenway - Harding Mall |
| 0.000000e+00 | 0.00000 | 2013 | 1.1000000 | Cumberland River Greenway - Rolling Mill Hill |
| 0.000000e+00 | 0.00000 | 2002 | 0.1000000 | Smithson School Playground |
| 0.000000e+00 | 0.00000 | 2000 | 16.8742281 | Stones River Greenway - Alta Lake |
| 0.000000e+00 | 0.00000 | 2003 | 5.0076261 | Stones River Greenway - Lebanon Pk to Dam |
| 0.000000e+00 | 0.00000 | 2003 | 0.6513379 | Stones River Greenway - Lebanon Pk to Dam |
| 0.000000e+00 | 0.00000 | 2005 | 16.6344681 | Stones River Greenway - Lebanon Pk to Dam |
| 0.000000e+00 | 0.00000 | 2014 | 135.4692117 | Whites Creek Greenway - Fontanel |
| 0.000000e+00 | 0.00000 | 1999 | 19.2924154 | Stones River Greenway - Lebanon Pk to Dam |
| 0.000000e+00 | 0.00000 | 2003 | 6.4750941 | Stones River Greenway - Lebanon Pk to Dam |
| 0.000000e+00 | 0.00000 | 2003 | 3.7454341 | Stones River Greenway - Lebanon Pk to Dam |
| 0.000000e+00 | 0.00000 | 2000 | 1.4684997 | Stones River Greenway - Alta Lake |
| 0.000000e+00 | 0.00000 | 2003 | 0.1818802 | Stones River Greenway - Lebanon Pk to Dam |
| 0.000000e+00 | 0.00000 | 2014 | 7.3042493 | Whites Creek Community Garden |
| 0.000000e+00 | 0.00000 | 2002 | 6.5039280 | Mill Creek Greenway - Whittimore Branch |
Before we create the animations, let’s do some data cleaning.
Are parks duplicated?
Code
df %>%
  filter(duplicated(park_name)) %>%
  kable(format = "html") %>%
  kable_styling("striped") %>%
scroll_box(height="300px")| lat | long | year_established | acres | park_name |
|---|---|---|---|---|
| 0 | 0.0 | 2003 | 0.4646216 | Stones River Greeenway - Two Rivers to Lytle |
| 0 | 0.0 | 2003 | 2.3579139 | Stones River Greeenway - Two Rivers to Lytle |
| 0 | 0.0 | 2003 | 0.1121120 | Stones River Greeenway - Two Rivers to Lytle |
| 1736155 | 665443.7 | 2015 | 0.4948844 | Gulch Greenway |
| 0 | 0.0 | 2001 | 2.5000000 | Cumberland River Greenway - Bicentennial Connector |
| 0 | 0.0 | 2008 | 0.0818948 | Cumberland River Greenway - Downtown |
| 0 | 0.0 | 2008 | 0.0117001 | Cumberland River Greenway - Downtown |
| 0 | 0.0 | 2008 | 1.7948271 | Cumberland River Greenway - Downtown |
| 0 | 0.0 | 2008 | 0.1613896 | Cumberland River Greenway - Downtown |
| 0 | 0.0 | 2008 | 0.0167640 | Cumberland River Greenway - Downtown |
| 0 | 0.0 | 2008 | 0.2653782 | Cumberland River Greenway - Downtown |
| 0 | 0.0 | 2005 | 2.7587219 | Whites Creek Greenway - Hartman Park |
| 0 | 0.0 | 2004 | 0.8719442 | Whites Creek Greenway - Hartman Park |
| 0 | 0.0 | 2006 | 1.0000000 | Whites Creek Greenway - Hartman Park |
| 0 | 0.0 | 2008 | 0.5361007 | Cumberland River Greenway - Downtown |
| 0 | 0.0 | 2008 | 0.6990988 | Cumberland River Greenway - Downtown |
| 0 | 0.0 | 2004 | 2.1957676 | Cumberland River Greenway - Metro Center |
| 0 | 0.0 | 2008 | 0.6213730 | Cumberland River Greenway - Downtown |
| 0 | 0.0 | 2004 | 1.0171761 | Cumberland River Greenway - Metro Center |
| 0 | 0.0 | 2004 | 0.8803449 | Cumberland River Greenway - Metro Center |
| 0 | 0.0 | 2004 | 1.4035318 | Cumberland River Greenway - Metro Center |
| 0 | 0.0 | 2004 | 0.1757014 | Cumberland River Greenway - Metro Center |
| 0 | 0.0 | 2004 | 0.1910113 | Cumberland River Greenway - Metro Center |
| 0 | 0.0 | 2004 | 0.3268539 | Cumberland River Greenway - Metro Center |
| 0 | 0.0 | 2004 | 0.8981220 | Cumberland River Greenway - Metro Center |
| 0 | 0.0 | 2004 | 0.1643947 | Cumberland River Greenway - Metro Center |
| 0 | 0.0 | 2004 | 0.8378213 | Cumberland River Greenway - Metro Center |
| 0 | 0.0 | 2004 | 2.2856454 | Cumberland River Greenway - Metro Center |
| 0 | 0.0 | 2004 | 0.1554352 | Cumberland River Greenway - Metro Center |
| 0 | 0.0 | 2004 | 0.4177268 | Cumberland River Greenway - Metro Center |
| 0 | 0.0 | 2008 | 0.6409715 | Cumberland River Greenway - Downtown |
| 0 | 0.0 | 2008 | 0.2436326 | Cumberland River Greenway - Downtown |
| 0 | 0.0 | 2004 | 0.6941219 | Cumberland River Greenway - Metro Center |
| 0 | 0.0 | 2004 | 0.1009122 | Cumberland River Greenway - Metro Center |
| 0 | 0.0 | 2004 | 0.1245130 | Cumberland River Greenway - Metro Center |
| 0 | 0.0 | 2001 | 0.2207411 | Cumberland River Greenway - Bicentennial Connector |
| 0 | 0.0 | 2001 | 0.4808856 | Cumberland River Greenway - Bicentennial Connector |
| 0 | 0.0 | 2001 | 1.0315835 | Cumberland River Greenway - Downtown |
| 0 | 0.0 | 2001 | 0.0586311 | Cumberland River Greenway - Downtown |
| 0 | 0.0 | 2001 | 1.1242000 | Cumberland River Greenway - Downtown |
| 0 | 0.0 | 1995 | 9.4195271 | Harpeth River Greenway - Warner - Morton Mill |
| 0 | 0.0 | 2013 | 12.0255760 | Harpeth River Greenway - Harpeth Springs |
| 0 | 0.0 | 2006 | 1.4861100 | Harpeth River Greenway - River Walk |
| 0 | 0.0 | 2006 | 1.8113980 | Harpeth River Greenway - River Walk |
| 0 | 0.0 | 2006 | 7.1464777 | Harpeth River Greenway - River Walk |
| 0 | 0.0 | 2006 | 10.9477867 | Harpeth River Greenway - River Walk |
| 0 | 0.0 | 2006 | 5.5703800 | Harpeth River Greenway - River Walk |
| 0 | 0.0 | 2006 | 2.4222613 | Harpeth River Greenway - River Walk |
| 0 | 0.0 | 2013 | 0.1684959 | Harpeth River Greenway - Warner - Harpeth Bend |
| 0 | 0.0 | 1995 | 2.2458589 | Harpeth River Greenway - Warner - Morton Mill |
| 0 | 0.0 | 2002 | 6.8735880 | Mill Creek Greenway - Blue Hole |
| 0 | 0.0 | 2001 | 3.5095535 | Mill Creek Greenway - Ezell Park |
| 0 | 0.0 | 2002 | 50.2175012 | Mill Creek Greenway - Blue Hole |
| 0 | 0.0 | 2002 | 10.5583895 | Mill Creek Greenway - Blue Hole |
| 0 | 0.0 | 2014 | 9.6707414 | Mill Creek Greenway - Mill Creek Park |
| 0 | 0.0 | 2014 | 0.3969118 | Mill Creek Greenway - Mill Creek Park |
| 0 | 0.0 | 2006 | 9.5489080 | Richland Creek Creenway - White Bridge Connector |
| 0 | 0.0 | 2006 | 3.9594254 | Richland Creek Creenway - White Bridge Connector |
| 0 | 0.0 | 2006 | 1.1946428 | Richland Creek Creenway - White Bridge Connector |
| 0 | 0.0 | 2006 | 1.3220493 | Richland Creek Creenway - White Bridge Connector |
| 0 | 0.0 | 2013 | 1.1000000 | Cumberland River Greenway - Rolling Mill Hill |
| 0 | 0.0 | 2003 | 5.0076261 | Stones River Greenway - Lebanon Pk to Dam |
| 0 | 0.0 | 2003 | 0.6513379 | Stones River Greenway - Lebanon Pk to Dam |
| 0 | 0.0 | 2005 | 16.6344681 | Stones River Greenway - Lebanon Pk to Dam |
| 0 | 0.0 | 1999 | 19.2924154 | Stones River Greenway - Lebanon Pk to Dam |
| 0 | 0.0 | 2003 | 6.4750941 | Stones River Greenway - Lebanon Pk to Dam |
| 0 | 0.0 | 2003 | 3.7454341 | Stones River Greenway - Lebanon Pk to Dam |
| 0 | 0.0 | 2000 | 1.4684997 | Stones River Greenway - Alta Lake |
| 0 | 0.0 | 2003 | 0.1818802 | Stones River Greenway - Lebanon Pk to Dam |
These rows look like errors so we will remove them.
We also need to remove unreasonable lat/long values.
Code
# Convert all long values to negative because of an error
df$long <- abs(df$long) * -1
How many parks are there?
Code
(num_parks <-nrow(df))[1] 123123 parks in Nashville – not bad!
Which years are represented in the data?
Code
range(df$year_established)[1] 0 2015Strange, it looks like the oldest park was established in year “0”. This must be a mistake.
[1] 2013 2013 2014 2014 2015 2015[1] 0 1901 1903 1907 1909 1910The true range of the data is 1901 - 2015. It looks like the park recorded as being established in year zero was a mistake. Let’s remove it from the dataset.
Now let’s take a look at the distribution of the years when parks were established. First, we’ll make a histogram.
Code
df %>%
  ggplot() +
  aes(year_established) +
  geom_histogram(bins=30, color="black", fill="grey") +
  labs(
    title = "Number of parks established in Nashville per year",
    subtitle = "",
    x= "Year Established",
    y= "Frequency") +
  cowplot::theme_cowplot(font_family = "Source Sans Pro",
                         font_size = 12)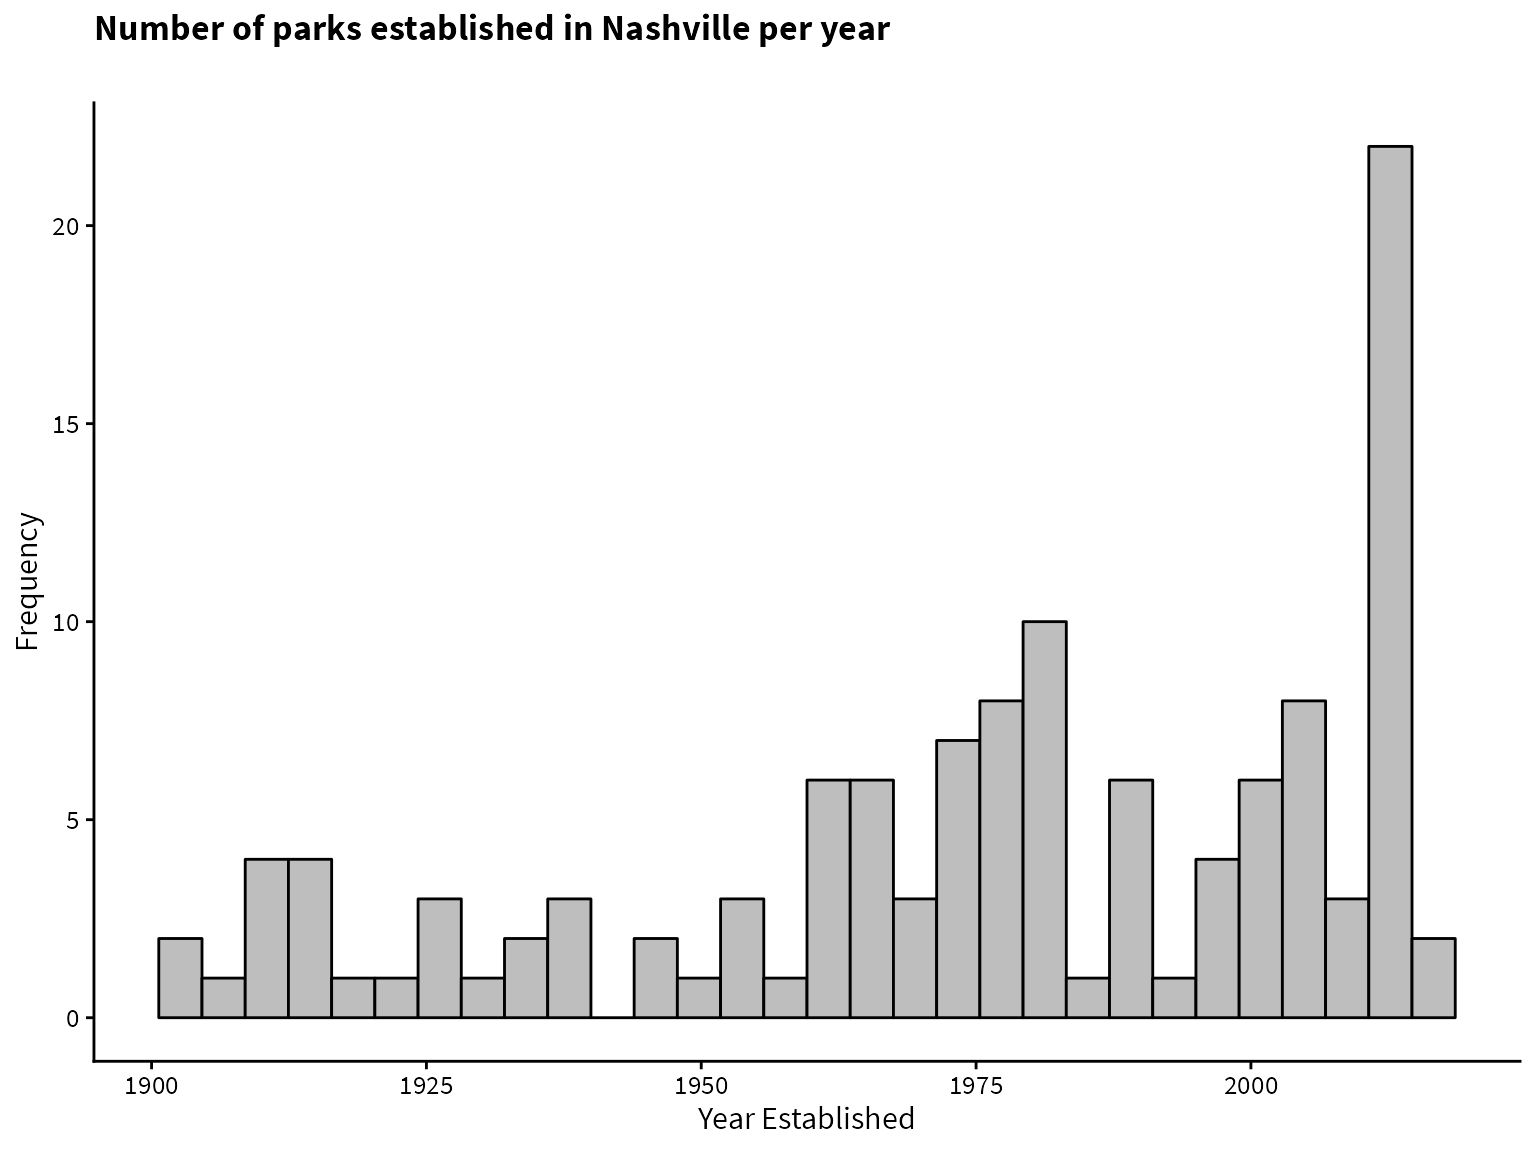
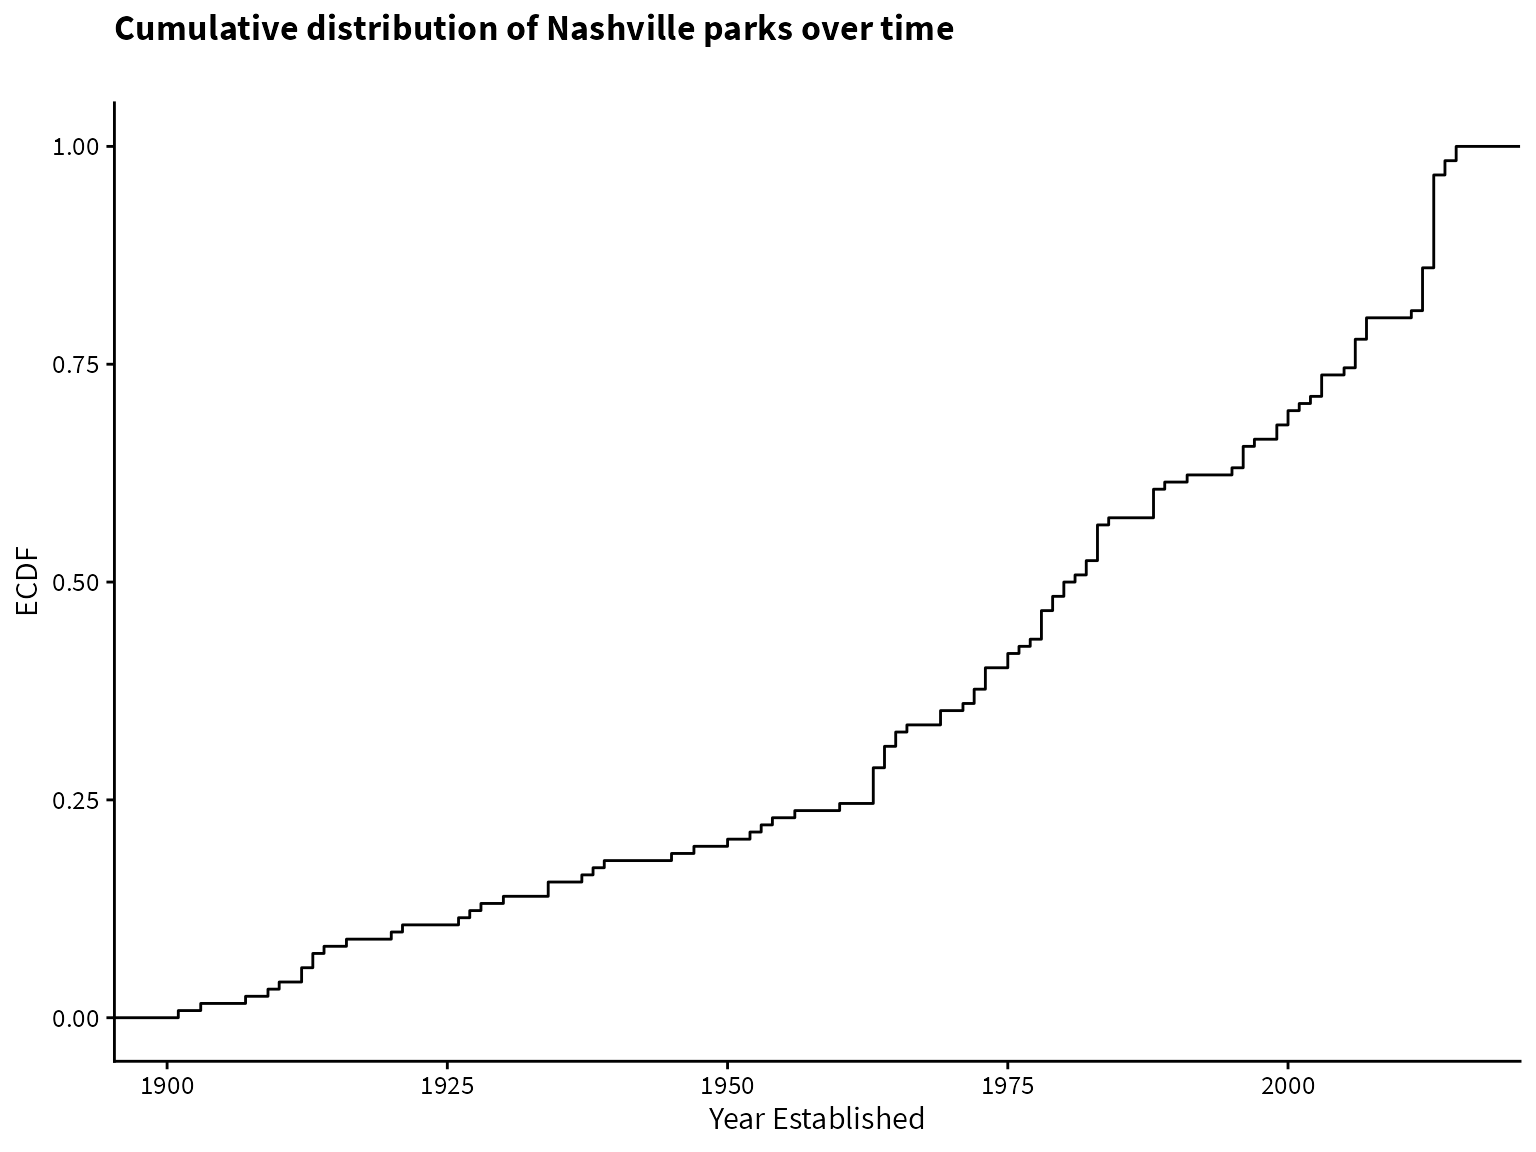
The rate of new park development looks to be increasing over time. An ECDF plot supports this observation.
Creating the Animation
Now that we’ve cleaned and explored the data, let’s create an animation with gganimate and ggmap to visualize the development of Nashville’s parks by year.
First, let’s try to just plot the locations of all the parks. Luckily, the (latitude, longitude) coordinates are provided.
We start with the qmplot() function from ggmap, which is a shortcut for plotting on maps, just like qplot() in ggplot2. We pass in the latitude and longitude coordinates and the data frame. The argument maptype = "toner-lite" indicates the type of basemap to use as the background. We also specify alpha=0.5 so we can see when the points overlap. I would like larger parks to be represented by larger circles, so we can map size to acreage by aes(size=acres). Then we add the extra theming using the cowplot package.
Code
qmplot(long, lat, data = df, maptype="toner-lite", alpha=0.5) +
  aes(size=acres) +
  labs(
    title = "Nashville Parks",
    x= "Longitude",
    y= "Latitude",
    caption = "Area corresponds to acreage \n Data available from Nashville Open Data") +
  cowplot::theme_cowplot(font_family = "Source Sans Pro",
                         font_size = 12) +
  theme(legend.position = "none")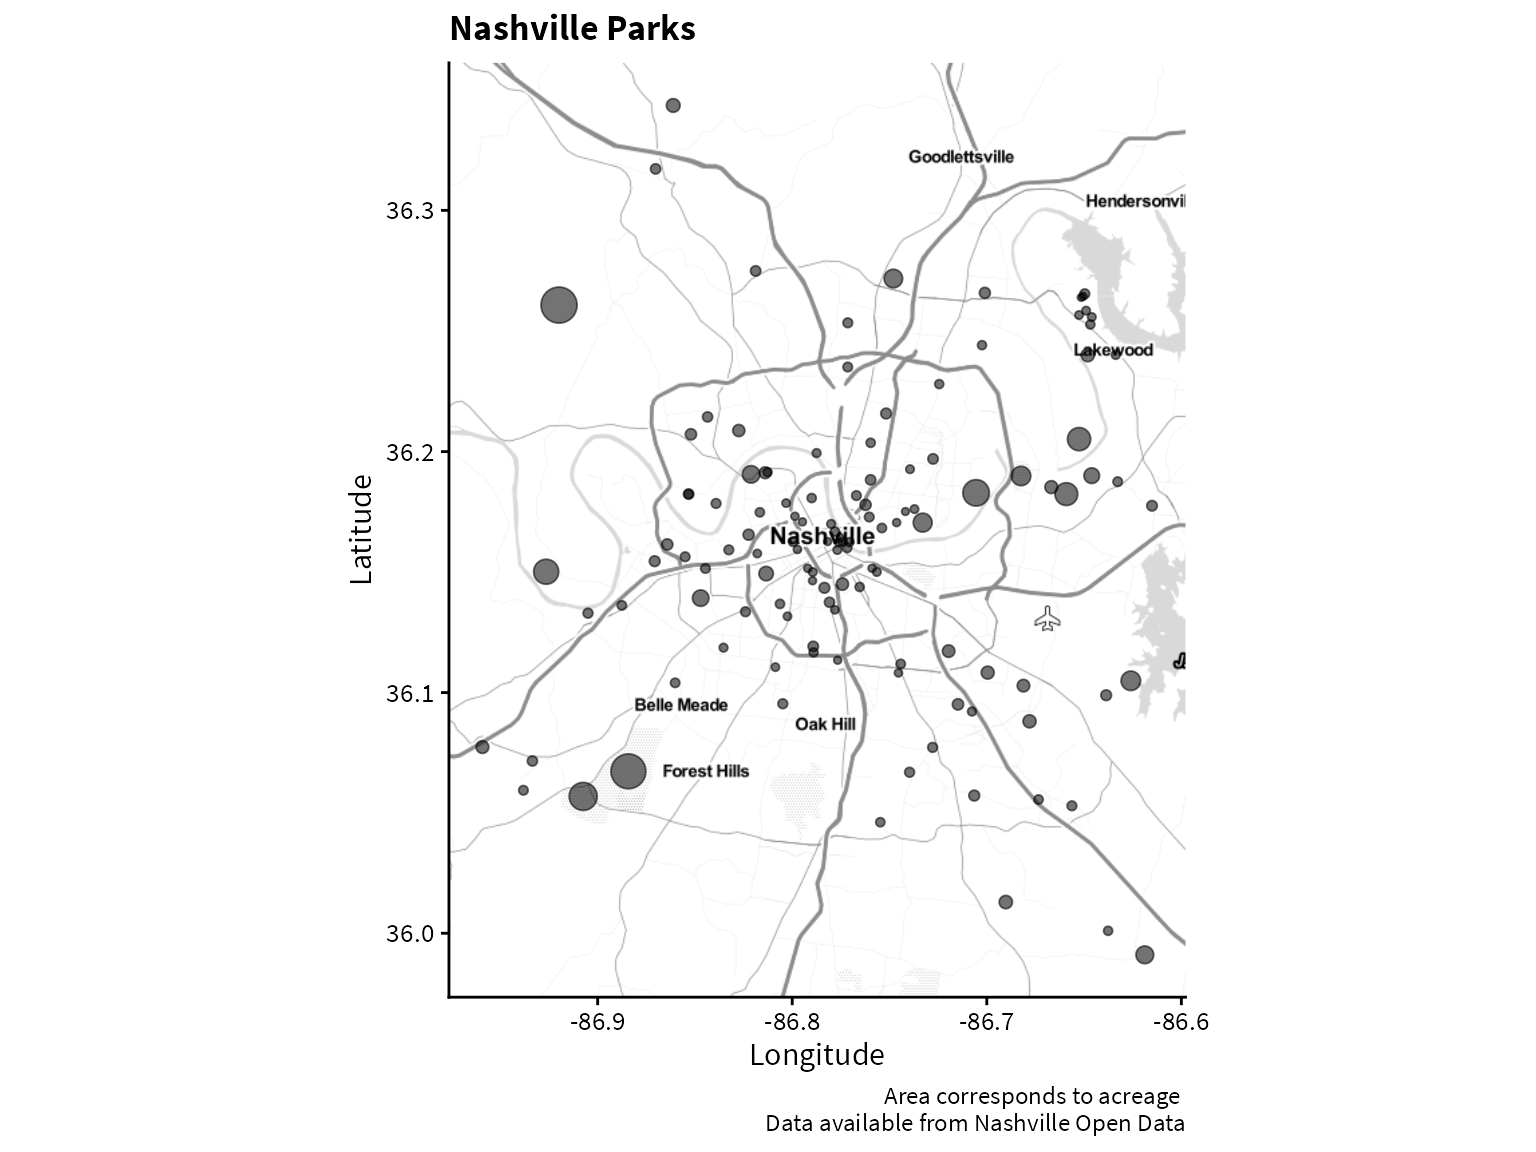
Looks pretty good already. Now let’s make this into an animation!
We will add the transition_states() function from gganimate and specify that each state of the animation is determined by year_established. We also set subtitle = "Year: {closest_state}" to display the year of the current frame.
Code
qmplot(x=long, y=lat, data = df) +
  aes(size=acres, group=year_established) +
  labs(
    title = "Nashville Parks",
    subtitle = "Year: {closest_state}",
    x= "Longitude",
    y= "Latitude",
    caption = "Area corresponds to acreage \n Data available from Nashville Open Data") +
  cowplot::theme_cowplot(font_family = "Source Sans Pro",
                         font_size = 12) +
  theme(legend.position = "none") +
  transition_states(year_established)
It’s animated now, but there are two problems.
First, the points are disappearing after each year. We can add shadow_mark(color="black") to have the points stay on the plot. We specify that the old points are colored black so that we can color the current points red, to highlight which points were just displayed.
Second, the passage of time is not constant. We want to have each frame change in increments of one year. In our current animation, the years are skipping between the years present in the data. To fix this, we convert year_established to a factor, and fill in the missing years.
Code
df$year_established <-
  df$year_established %>%
  # convert to factor
  as.factor() %>%
  # add extra years
  fct_expand(1900:2019 %>% as.character) %>%
  # sort years
  fct_relevel(1900:2019 %>% as.character)
Now that we’ve made those changes, let’s try again.
Code
qmplot(long, lat, data = df,
       maptype = "toner-lite", alpha=0.5, color="red") +
  aes(size=acres, group=year_established) +
  labs(
    title = "Nashville Parks",
    subtitle = "Year: {closest_state}",
    x= "Longitude",
    y= "Latitude",
    caption = "Area corresponds to acreage \n Data available from Nashville Open Data") +
  cowplot::theme_cowplot(font_family = "Source Sans Pro",
                         font_size = 12) +
  theme(legend.position = "none") +
  transition_states(year_established) +
  shadow_mark(color="black")
Looks good! But wait a second… the animation only goes to 1950. Wasn’t it supposed to go to 2015? This is a little quirk of gganimate. By default, the animation is capped at 100 frames. For the transition_states() animation, by default a single frame is allocated for each state, and another frame is allocated for transitions between states. So 100 frames can represent 50 years of data. The animation is cut short because we have more than 50 years of data.
Let’s fix this by saving the animation to a variable, and then using the animate() function to increase the number of frames.
Code
parks_anim <-
  qmplot(long, lat, data = df,
       maptype = "toner-lite", alpha=0.5, color="red") +
  aes(size=acres, group=year_established) +
  labs(
    title = "Nashville Parks",
    subtitle = "Year: {closest_state}",
    x= "Longitude",
    y= "Latitude",
    caption = "Area corresponds to acreage \n Data available from Nashville Open Data") +
  cowplot::theme_cowplot(font_family = "Source Sans Pro",
                         font_size = 12) +
  theme(legend.position = "none") +
  transition_states(year_established) +
  shadow_mark(color="black")

animate(
  parks_anim,
  nframes=300, # number of frames to compute
  )
My preferred method of rendering the animation is to use ffmpeg, instead of the default GIF renderer, because it creates videos (.mp4) rather than GIFs. You will need to install ffpmeg on your computer separately. Using ffmpeg also allows for finer control over the frame rate of the animation and creates smaller files. I’ll show how to use it below.
The animate() function has parameters for duration (total duration in seconds), fps (frames per second), and nframes (total number of frames). You can specify any two. For our case, we give the duration and number of frames, and gganimate figures out the proper frame rate to fit the specified number of frames into the specified number of seconds.
We also set res=300 to increase the resolution. This has the side effect of making the font appear larger, so we decrease the font size in the call to theme_cowplot().
Be warned that this may take a bit of time to animate. Here’s the final result!
Code
parks_anim <-
  qmplot(long, lat, data = df,
       maptype = "toner-lite", alpha=0.5, color="red") +
  aes(size=acres, group=year_established) +
  labs(
    title = "Nashville Parks",
    subtitle = "Year: {closest_state}",
    x= "Longitude",
    y= "Latitude",
    caption = "Area corresponds to acreage \n Data available from Nashville Open Data") +
  cowplot::theme_cowplot(font_family = "Source Sans Pro",
                         font_size = 10) +
  theme(legend.position = "none") +
  transition_states(year_established) +
  shadow_mark(color="black")

animate(
  parks_anim,
  duration=15, # duration of the animation in seconds
  nframes=768, # number of frames to compute
  height = 6,
  width = 6,
  units = "in",
  res = 300, # resolution of the output
  renderer = ffmpeg_renderer() # render to video with ffmpeg
  )